National Taiwan University of Science and Technology (NTUST) operates a campus-wide Smart Energy Management System. It brings electricity, water, classroom control, chiller, VRV air-conditioning and street-lighting modules together on one web platform that continuously monitors energy use across the university. Main meters are installed on both utility accounts (main campus 00-84-9650-11-0, contract capacity 5,000 kW; Research Building campus 00-84-9654-11-4, contract capacity 900 kW). Sub-meters in the major buildings, including the Administration Building, Library, college and teaching buildings, student dormitories and International House, record electricity consumption (kWh) and demand (kW) in real time.
The system provides a campus electricity map (“Electricity Overview”), hourly and daily data by building (“Building Electricity”), “Meter Query”, “Electricity Bill” and “Statistical Report” functions. With these, facility managers can compare consumption by building, time period and date, identify energy waste systematically and take corrective action.
- Building-level metering to find high consumers: Each building’s daily and month-to-date consumption is shown on the campus map, so managers can compare buildings at a glance and spot those with unusually high or rising use.
- Demand monitoring to avoid exceeding contract capacity: Real-time and monthly peak demand for each account is displayed against the contract capacity. This helps staff schedule air-conditioning and large equipment, avoiding peak overruns and unnecessary charges.
- Time-based comparison to reveal base-load and standby waste: Daily building data lets managers compare weekday and weekend use. For example, from 1 to 7 November 2026 the main campus station used about 32,600–34,800 kWh on each weekday but about 20,200 kWh on Saturday 7 November. If consumption at night or on holidays does not fall with occupancy, equipment has been left on or is drawing standby power, and that building is prioritised for improvement.
- Control and continuous improvement: The classroom control, chiller, VRV and street-lighting modules let staff schedule, remotely switch off or optimise the equipment behind the waste they find. Statistical reports then track how much each improvement saves.
NTUST Smart Energy Management System: http://140.118.104.124/manage/pc/content/index.aspx
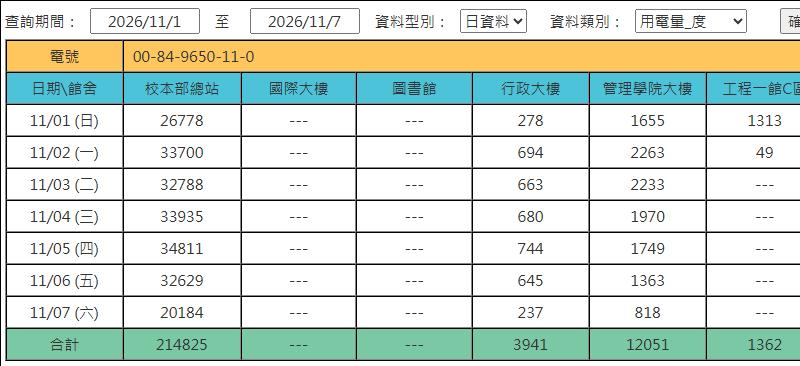
Figure 1. Daily electricity by building (1–7 Nov 2026): comparing weekday and weekend use to identify base-load and standby waste