1.Overview
National Taiwan University of Science and Technology (NTUST) uses its Smart Energy Management System to track both where campus energy comes from and how much is used. The system records, in real time, the electricity generated by on-campus green (renewable) energy installations. It also records grid electricity purchased through the university’s two utility accounts (main campus 00-84-9650-11-0 and Research Building campus 00-84-9654-11-4) and consumed by each building. With both low-carbon generation and total consumption in one place, the university has the data it needs to calculate its share of low-carbon energy and the carbon emissions from electricity use.
On the home page, the “Green Power Information” panel shows green-power generation for the current day and month; on 7 November 2026, for example, it showed 979 kWh for the day and 8,420 kWh month-to-date. In the Analysis module, “Annual Electricity Statistics” charts each account’s year-by-year consumption. Main-campus consumption fell from about 22.42 GWh in ROC year 105 (2016) to about 19.84 GWh in 108 (2019), and was about 21.24 GWh in 112 (2023). These charts let the university review the long-term effect of its energy-saving and carbon-reduction measures.
2.How Low-carbon Energy Is Tracked
- Real-time renewable generation: Daily and monthly green-power generation updates continuously, so the contribution of self-generated low-carbon electricity is always visible.
- Grid consumption and emissions accounting: Consumption for each account and building can be exported by day, month and year. Combined with the grid emission factor, it gives electricity-related emissions and the share of total use met by green power.
- Long-term trend review: The “Annual Electricity”, “Yearly Electricity” and “Taipower vs. System” comparison functions show year-on-year changes in consumption and demand, so progress toward carbon-reduction targets can be checked.
- Analysing efficiency measures: Further analyses (optimal contract capacity, power factor, elevator regenerative energy, chiller COP, and the benefits of circulation fans and shading devices) track how much each low-carbon and energy-saving measure actually delivers.
NTUST Smart Energy Management System: http://140.118.104.124/manage/pc/content/index.aspx
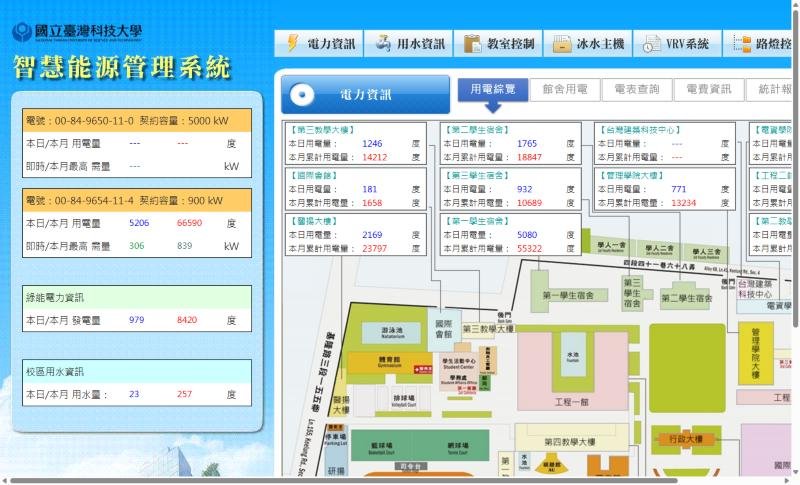
Figure 1. NTUST Smart Energy Management System home page
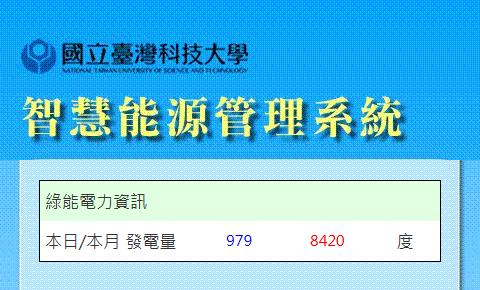
Figure 2. “Green Power Information” showing daily and monthly on-campus green-power generation (7 Nov 2026: 979 kWh / 8,420 kWh)
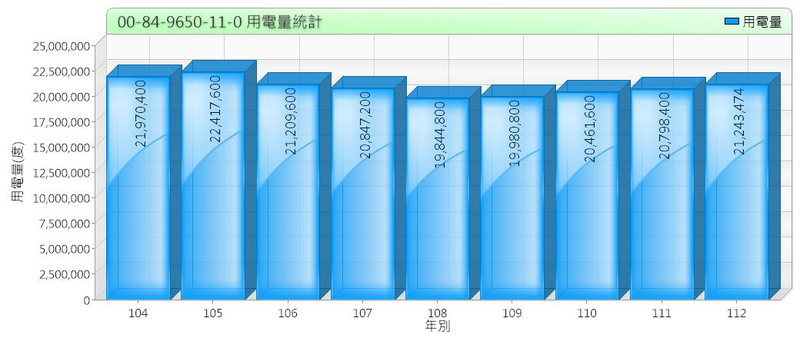
Figure 3. Analysis module “Annual Electricity Statistics”: main-campus consumption (kWh) for ROC years 104–112 (2015–2023), used to track long-term energy use and carbon reduction